
By Dan Roberts
One of the more contentious issues in marketing planning is resource allocation. Country and industry managers will argue their cases and put forward arguments about why their segment could use more resources. In situations like that, you need to have some hard data to fall back on. Your own results by country or industry might be informative, but they will be tempered by the historic resources applied and the length of time they have been addressed. Newly entered countries or industries could be unfairly represented. An independent data source can help to avoid these problems.
Global Overview
To illustrate how vital accurate marketing data can be in making these decisions, I will use the case of a fictitious technical applications vendor who needs to decide where its limited resources are going to be applied across its target countries and industries.
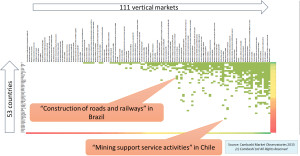
Using the data supplied by an independent specialist, which is represented in the accompanying graphs and charts, I show how the fictitious vendor can take a quick overview of spend on technical applications across all of the countries and industry sectors. In doing this, we see some interesting sectors emerge. Figure 1 shows the data by country (vertical axis) and sector (horizontal axis), with data points shown in USD. The chart has been sorted so that the biggest countries are at the top, while the biggest industries are at the right. The top 10 percent of country/industry intersections are shaded in green.
It’s no surprise to see a cluster of green in the top right hand corner—this is where you find the largest verticals in the largest country markets. The outliers are more interesting. Moving down or left in this table, you are looking at smaller markets. For any of these to make it into the top 10 percent, there’s got to be something interesting about these markets. I’ve picked out a couple from countries we’ll be looking at later.
Both examples trigger thoughts about the economy—mining support service activities are likely to be related to the large commodities industry in Chile. The question of whether the spend by the roads and railways construction sector in Brazil is just a blip triggered by the world cup and the 2016 Olympics, or whether it’s a long-term feature of the market is the sort of discussion that might be started by this chart. You can imagine the planning team will focus on the countries and sectors they know about and look for opportunities, explanations, and insights into the market.
A set of 6,000 data points is far too much detail for most planning tasks, but it is easy to simplify the data by aggregating the verticals into the higher level industry groups your company uses and select only the countries that your company targets.
Country Summary
Country managers would be more interested in a simpler view, showing the data for their country and the target industry
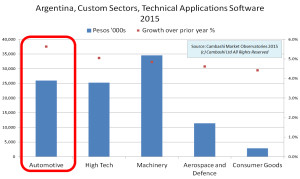
sectors. Figure 2 shows the data for Argentina. It is based on the same data as in Figure 1, but only 50 of the 111 industry sectors have been selected and grouped into the five segment definitions used by the company. It’s important that you use your own definition rather than someone else’s. That is why the 111 sectors are useful—it makes it easier to map to your peculiar definitions with greater granularity. The other important difference for this chart is that the data is in the country’s operational currency—in this case Argentinian pesos. Forecast industry growths are also shown for 2014/2015.
This is the kind of information that will allow the country manager to think about how to deploy resources. The goal of course is to allocate people and budget into the right areas.
Country managers will add a lot of value with their knowledge of the buying cycle in the territory. The local buying culture will determine exact definition of roles and the way to organize the in-country team.
Within Argentina, automotive is second only to machinery, but has the highest growth so it will be important in the plan.
The critical point is that this is just one view of the same single dataset, so the numbers you share with country managers will match the numbers you share with industry managers.
Industry Summary
Industry managers will also require a similarly simplified set of charts, in this case showing the industry segment across the target countries shown in Figure 3. To compare across different countries, I have used USD rather than operational currency to make it easier to compare absolute sizes. But it is worth remembering that currency changes can have an effect on growths.
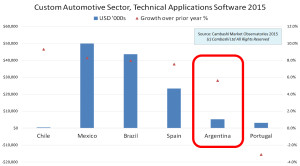
I saw the automotive sector in Argentina, in Figure 2, where it was one of the larger sectors with one of the larger growths. But in the context of these other countries, it has lower growth than some and a relatively small overall opportunity. It’s going to be hard for Argentina to be a special focus for automotive initiatives. However, the growth is high enough, and given the situation we saw for other sectors in Argentina, a set of automotive industry initiatives focused on growth would make sense for this country.
Size and Growth
To manage resources across target industries and countries, it is helpful to look at another view of the data. Figure 4 shows the same set of data, calculated as a proportion of the total market under consideration.
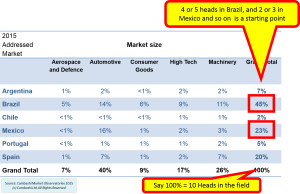
You could start by considering a headcount allocation in proportion to the size of the opportunity. Let’s say history and current thinking on budgets and headcounts mean you are expecting a total of 10 in-country sales and marketing heads. Just by proportions, you might expect four or five in Brazil and two or three in Mexico, and you can see the overall totals for each sector.
There are plenty of good reasons why the optimum headcount allocation will be different to this. One is the ‘start-up’ effect. It takes quite a few years to establish your business in a country or vertical. The numbers here tell you where the target is; but this is the steady-state. The profile doesn’t tell you how to get started in a market. This is where “the way we do things round here,” recent experiences, and the approach of senior sales and marketing people are all significant.
For this business, Mexico, Portugal, and Spain are the established markets; Argentina and Chile are profitable at a low level, with business handled through resellers; and one of this year’s corporate objectives is to build on last year’s creation of a direct sales operation in Brazil. As a result, there is a ring-fenced corporate budget for Brazil, so we can plan our 10 heads across the other five countries.
If you look back at the global overview we started with, it shows one of the global anomalies was mining support service activities in Chile—in the top 10 percent of technical applications software markets, even though globally this is a smallish sector, and Chile is a smallish country market. So the one percent figure for machinery in Chile should trigger some questions. Does this include mining support services? The answer in this custom definition is ‘no.’ This in turn should trigger some action—for example, pick up the phone and ask our reseller in Chile about the scope of companies they target in the machinery sector; whether the mining service companies are significant; whether we visit them; whether we go to the same trade shows, and so on. The important point to note is that the numbers can trigger this sort of action and can help the people who drive the business see all of the opportunities.
Alternatively, if you take the view of the company accountant, you might wonder why we are even concerned with Chile at all as it’s only two percent of the overall market. We need another view of the market for that.
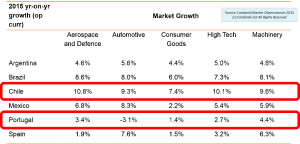
Figure 5 shows the same data, but showing the growth of 2015 over 2014, with growths calculated in operational currency. Here you can see why Chile is interesting. It’s small but also the fastest growing in all verticals. The person responsible for sales in Chile will want sales resources and marketing support tuned to new opportunities.
In contrast, the situation in Portugal is different. Automotive is shrinking, there’s not much growth in consumer goods. In fact, it has the lowest growth in four of the five sectors. So, the priority for Portugal will be more defensive—for example, sales and marketing initiatives designed to extend the footprint in existing accounts. There’s a story and a response behind each of these growth numbers.
Machinery is an example for Portugal. It’s the sector with the leading growth in Portugal so perhaps it’s one to focus on.
Segment Classification
It is important to consider both size and growth when allocating resources. But there are different requirements for different segments. Figure 6 plots the 25 segment/country intersections by size and growth.
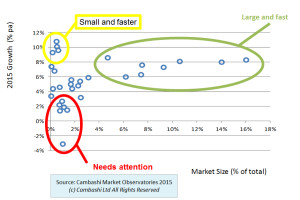
The data points have been anonymized so that preconceived ideas about the industries or countries are avoided.
There are some clear groups of opportunities. The large, fast-growing opportunities are on the right, a group of small, but very fast-growing segments at the top; and a set of small, slow-growing segments that may need individual attention.
Resource Allocation
Now that we have assigned the segment/country intersections into groups, we can de-anonymize them and add the market size percentages back in, which is shown in Figure 7.
With all of the green sectors, it is easy to see why there is a corporate drive in Brazil and consumer goods and that the Portuguese office will face the greatest challenges. These could affect the resource allocation either way—adding resources to improve the situation, or deciding to withdraw from that market altogether.
Now we have to try to pull all this together. Remember that in this scenario, the corporate initiative to get started in Brazil means we’ve got a branch office there, with five sales and marketing heads in place as part of the corporate Brazil launch strategy. We don’t have to justify them in our budget, just point them to the right industries.
So if Brazil already has five heads covering their 45 percent of the market, this means our budgeted 10 heads must cover the remaining 55 percent of the market. Doing the calculations we get three heads in Spain; one dedicated to automotive, one dedicated to machinery, and the third handling the other sectors. You also have three heads in Mexico; two on automotive, the third handling the other sectors. In both Mexico and Spain, there is the security of one or two large and fast segments, the ones shown in green in Figure 7.
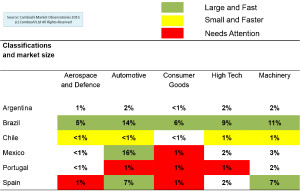
Because Chile has such fast growth, you may decide to justify one dedicated person, but not the overheads of a local office. This would probably depend on corporate strategy. Given these numbers, it looks as if a head office person with a budget to recruit, train, and support resellers in Chile could be a reasonable approach.
This covers all if the fast growing markets, both large and small, but the pattern of the markets which need attention—the red ones—forces you to think long and hard about business in Portugal; and also your activities in the consumer goods sectors.
Let’s assume you want to stay in Portugal. We might propose one person for Portugal to focus only on machinery. That leaves two heads to cover Argentina, but there’s not much to justify them spending time on consumer goods, it looks as if the consumer goods sector will have to rely on the corporate initiative in Brazil.
So this means we’ve got an initial answer to the headcount question. Of course this is just a first step. There’s still discussion about budgets, about whether you need people in country or if some of these roles should be head office industry specialists. But the point is you are using the market data to encourage evidence-based decisions. SW
Dan Roberts is senior consultant for the research analyst and consulting group, Cambashi, and is the organization’s industry segmentation expert. He has developed several of Cambashi’s robust data analysis reports called the Observatories. Roberts works with IT vendors to ensure that industry and employment observatory data are tailored to each vendor’s specific needs, providing them with insights to improve their strategic marketing decisions.
Dec2015, Software Magazine

